Here is Price List of Various Projects of Sobha Developers in Bangalore / Bengaluru, Chennai and Pune.
Price List of Sobha Developers Projects in Bangalore
Bangalore Sobha City - Phase II Near Hebbal flyover - 4500 / sft
Bangalore Sobha Pristine Belandur, ORR Residential apartments 4500 / sft
Bangalore Sobha City - Phase I Near Hebbal flyover Mixed-use residential 4500
Bangalore Sobha Signature Off Sarjapur Road Residential apartments 4500
Bangalore Sobha Forestview Kanakpura Road Residential apartments 4500
Bangalore Sobha Habitech Hopefarms, Whitefiled Residential apartment 4750
Bangalore Hosakerehalli Property Hosakerehalli, Mysore road Residential apartments 3500
Bangalore Sobha Tranquility Hosahalli, Kanakpura Road Residential apartments 3500
Bangalore Sobha Gladiola Thalaghattapura, Kanakpura Road Residential apartments 3500
Bangalore Dairy Circle Property Bannerghatta road Mixed use residentia 4000
Bangalore City Property Minerva Mills, Gopalapura Mixed-use residential 8000
Price List of Sobha Developers Projects in Chennai
Chennai Sobha Serene Seneerkuppam, Porur Residential apartments 4500
Chennai Sobha Meritta Pudupakkam Residential apartments 4500
Price List of Sobha Developers Projects in Pune
Pune Sobha Garnet NIBM Kondwa 3900
Pune Sobha Ivory NIBM, Kondhwa 3500
Pune Thergaon property Thergaon 3000
Tuesday, February 28, 2012
Monday, February 27, 2012
Bangalore Strong Commercial Today = Residential Tomorrow
Bengaluru absorbed 11.7 mn sq ft of commercial space in CY2011, 33% of the overall absorption of India’s top seven cities. Bengaluru outperformed as it is
an IT hub and IT/ITES absorbed 35% of the commercial space across the top seven Indian cities. Bengaluru is likely to add 22-23 mn sq. ft of commercial space over CY2012-14, implying demand will outpace supply, leading to lower vacancies and rising rentals.
Strong demand for commercial space augurs well for residential volumes in the coming years. In CY2011, Bengaluru created 0.12 mn (assuming 100 sq ft of space per person) future customers for residential space, who can potentially consume 70 mn sq ft (1,200 sq ft per person assuming 50% will buy) of residential space.
Residential sales have been steady in Bengaluru at 4mn sq ft/month in CY2011, which is 20% of total sales in India’s top seven cities.
Wednesday, February 15, 2012
Delhi NCR - 4 Year Property Price Trends
Tuesday, February 14, 2012
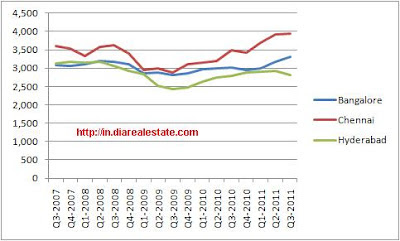
4 Years Property Price - Chennai Vs Bangalore Vs Hyderabad
Monday, February 13, 2012
Last 4 Years Bangalore Property Price Vs Sales - Analysis
We would like to share with our readers Home / Apartment Prices Vs Sales in Bangalore in the last 4 years 2007 to 2011. Doesn't include Luxury Apartments. The Average ones that are being sold for the Middle Class is the focus of our study.
In the Chart Below
Maroon Line - Average Property / Apartment Price / SFT LHS
Blue Line - Sales in Mn SFT / RHS
 As evident from the Graph above, Bangaloreans / Bengalurueans made their Home Purchases in-line with the Rising Property Prices. Except in Q2/Q3 2009 when the property prices bottomed out, over 7.5 Mn SFT of apartments were absorbed and now when the prices have hit an all time High of Rs 3300 / SFT, Sales has also shot up. The herd mentality of Software Engineers ;-)
In the Chart Below
Maroon Line - Average Property / Apartment Price / SFT LHS
Blue Line - Sales in Mn SFT / RHS
 As evident from the Graph above, Bangaloreans / Bengalurueans made their Home Purchases in-line with the Rising Property Prices. Except in Q2/Q3 2009 when the property prices bottomed out, over 7.5 Mn SFT of apartments were absorbed and now when the prices have hit an all time High of Rs 3300 / SFT, Sales has also shot up. The herd mentality of Software Engineers ;-)
Subscribe to:
Posts (Atom)

